Sinus bradycardia
Sinus bradycardia
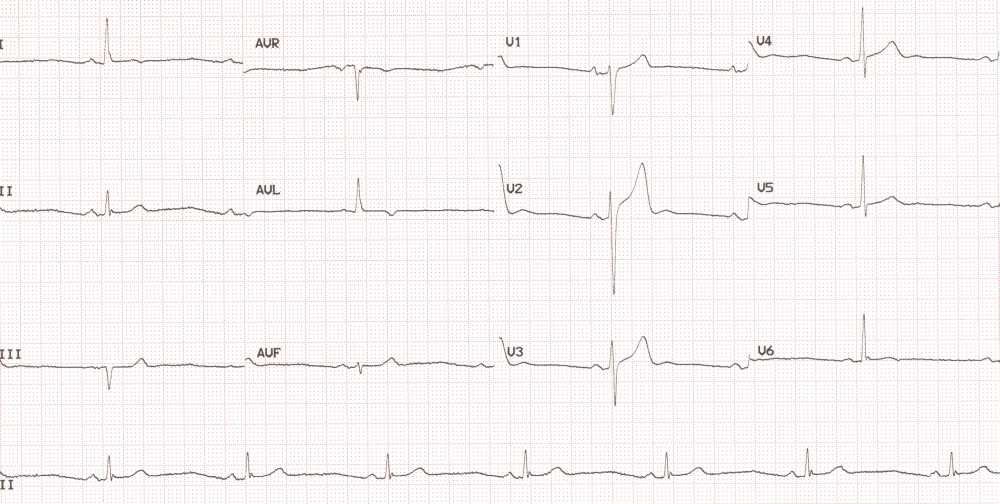
12 lead ECG tracing showing sinus bradycardia at a rate of around 45 per minute. Only one complex each has been recorded in each of the 12 leads due to the bradycardia. A lead II rhythm strip is recorded at the bottom of the tracing which has captured 7 complexes. Mild ST segment elevation seen in V1 can be a normal variant. But the T waves are flat in leads I and V6 and inverted in aVL. This can be due to myocardial ischemia, especially since T wave in V1 is definitely taller than that in V6. The reason for bradycardia could be anything from sinus node dysfunction to bradycardia due to beta adrenergic blockers being taken for coronary artery disease with angina pectoris. When a Q wave is seen in lead III as in this case, it was customary to repeat a lead III recording in deep inspiration to see if it disappears. The P wave is positive in leads I and II while it is biphasic in lead III. This can very well be taken to be in the normal range for a sinus P wave.
Related Posts


About The Author
Johnson Francis
Former Professor of Cardiology, Calicut Govt. Medical Kozhikode, Kerala, India. Editor-in-Chief, BMH Medical Journal