Right atrial overload and right ventricular hypertrophy
Right atrial overload and right ventricular hypertrophy
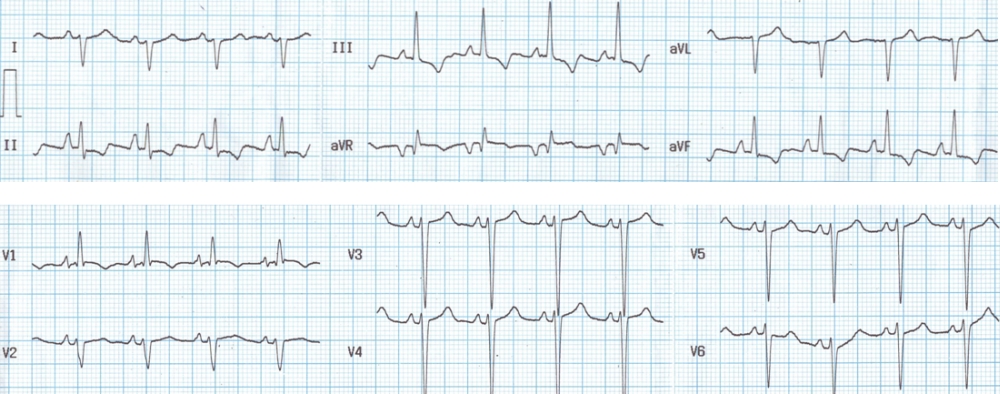
Right atrial overload is manifest as tall sharp P waves in lead II and V1. The cut off values are P wave amplitude more than 0.25 mV in lead II and 0.1 mV in V1. Dominant R waves in V1 and deep S waves in V6 indicate right ventricular hypertrophy. Sokolow-Lyon criteria for RVH mentions that R wave in V1 + S wave in V5/V6 should be 1.1 mV or more. There is also a clockwise rotation in the QRS pattern between V1 to V6. QRS axis is around +120 degrees with aVR biphasic and lead III showing tallest QRS complex. Right axis deviation is also due to right ventricular hypertrophy. T wave inversion in inferior leads and V1 could be due to right ventricular hypertrophy itself.
RVH in this case is type A with dominant R in V1 and deep S in V6. This type is seen in pulmonary stenosis. Type B RVH shows dominant R waves in V1 without deep S in V6. Deep S in V6 without dominant R in V1 seen in chronic obstructive lung disease with cor-pulmonale is called type C RVH. Strictly speaking the types are classified depending upon vector cardiographic features and not based on scalar ECG.
About The Author
Johnson Francis
Former Professor of Cardiology, Calicut Govt. Medical Kozhikode, Kerala, India. Editor-in-Chief, BMH Medical Journal
Sir type b rvh is seven in which condition?
Conventional teaching was that type B RVH occurs in mitral stenosis with pulmonary hypertension. Actually the classifications were based on vectorcardiogram. Scalar ECG pattern is just an approximation. Other patterns of RVH have also been reported in mitral stenosis: https://www.sciencedirect.com/science/article/abs/pii/S0012369215368136