Central venous pressure tracing
Central venous pressure tracing
Central venous pressure tracing (CVP) monitoring is done in critical care units to assess the right sided filling pressure in guiding intravenous fluid therapy. When the blood pressure is low in the setting of a low central venous pressure, fluid resuscitation alone may be needed to bring up the blood pressure without any inotropic support. Assessment of central venous pressure is also useful while weaning off inotropic supports. If the central venous pressure is low while weaning inotropic support, there will be a recurrence of hypotension. Intravascular volume may be low even with normal blood pressures while on inotropic support. This leads to fall in blood pressure while weaning off inotropes or vasoconstrictors.
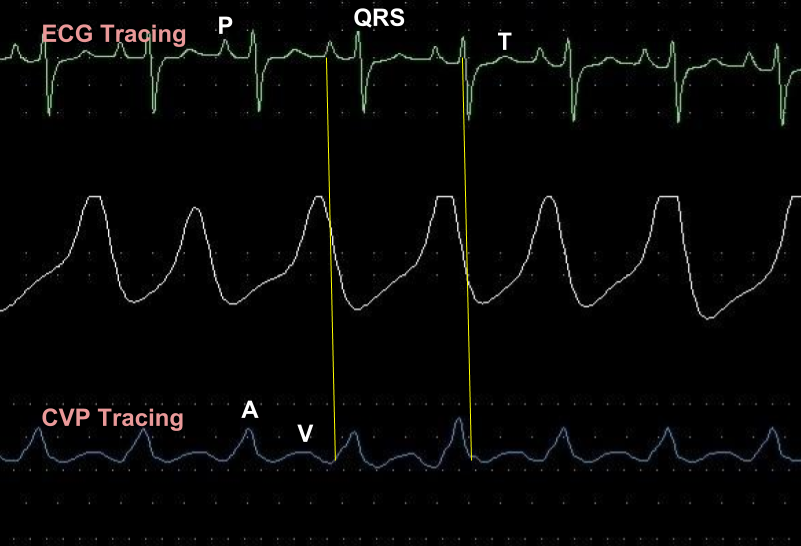
The upper green tracing is the ECG, middle white tracing tracks the respiration, though at a slower sweep speed and the lowermost blue is the central venous pressure tracing. The peaked wave immediately after the P wave on the ECG is the ‘a’ wave and the rounded wave after that is the ‘v’ wave. ‘a’ wave is due to atrial contraction. The descent after the ‘a’ wave is the ‘x’ descent. The ‘c’ wave occurs on this descent during contraction of the right ventricle due to bulging up of the tricuspid valve. ‘c’ wave is not well seen here. The descent after ‘c’ wave is known as the x’ (x prime) descent. The ‘v’ wave occurs during the venous filling of the right atrium when the tricuspid valve is closed. The descent following the ‘v’ wave due to opening of the tricuspid valve is known as the ‘y’ descent. This occurs due to rapid emptying of the right atrium into the right ventricle.
‘a’ wave becomes prominent when the atrial contraction is more forceful as in the case of ventricular hypertrophy with diastolic dysfunction or when there is obstruction to the tricuspid valve. A prominent ‘v’ wave (really a ‘cv’ wave) occurs when the tricuspid valve is regurgitant so that right ventricular blood is forced into the right atrium during ventricular systole. These prominent waves can also be visible clinically in the jugular venous pulse and are important diagnostic clues.
Mean central venous pressure is calculated by electronic averaging of the waveform and displayed on the monitor. It is the mean central venous pressure which is considered for guiding fluid therapy rather than the waveform. Waveform is mainly used as clinical diagnostic clues while assessing the jugular venous pulse.
Related Posts


About The Author
Johnson Francis
Former Professor of Cardiology, Calicut Govt. Medical Kozhikode, Kerala, India. Editor-in-Chief, BMH Medical Journal